Author: Dave Smith
Viewers: 1,407
Last month viewers: 1
Categories: PHP Tutorials, Sponsored
PHP Tools is a extension of Microsoft's Visual Studio that uses and enhances the powerful debugging options that ships with this popular IDE.
Read this article to learn how to take advantage of PHP Tools to quickly debug your PHP applications.
Contents
Introduction
Error highlighting
Handling errors
Exception Settings
Working with breakpoints
Stepping through your code
Modifying Values
Conclusion
Introduction
This is the last article in a series of three about PHP Tools, a extension for Microsoft Visual Studio that makes it support PHP.
In the first article I have discussed the advantages of using an Integrated Development Environment (IDE) and how to install and setup PHP Tools for use with Microsoft's Visual Studio.
In the second article I have presented a practical example for using the IDE. In this article we will explore how debugging features can make our lives as developers so much easier.
Error highlighting
While PHP Tools does offer a complete suite of tools specifically geared to debugging your code, which will be discussed in the following sections, I have to mention the one that will be used the most: error highlighting.
You have developed your concept, know all the parts you will need and the flow that will make it all happen. It is now time to get to the fun part, writing the code so that you can see your project in action. In all the excitement you type your first line of code.
inclde_once('myclass.php');If you are anything like me, you know exactly what that line does and what the correct syntax is. My mind auto-corrects the code so that at a glance everything looks okay. The IDE, on the other hand, has placed a squiggly green line under inclde_once, prompting me to take a close look.
When I hover my mouse over the highlighted error I am told that there is a call to an unknown function inclde_once. I can correct it immediately to include_once without having to run the code and watch my script fail.
Typos are the most common errors in coding and are some of the most difficult to locate, even when you are told exactly which line the error has occurred on. Even worse are the ones that do not halt execution and can produce surprisingly unexpected results. Error highlighting will catch most of these and make your coding life so much easier.
Handling errors
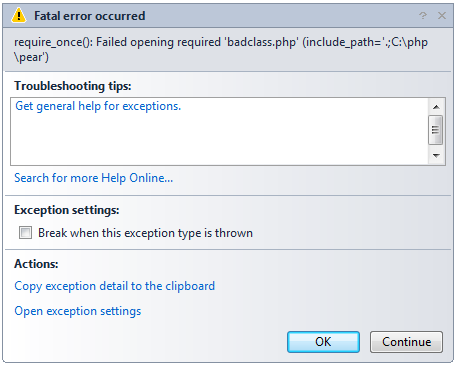
The IDE will be able to identify most errors, however it will not be able to catch them all. Suppose that you require a class be included and that class does not exist...
require_once('badclass.php');This line of code will not be highlighted as an error yet it will result in a fatal error when PHP attempts to locate the missing class. The IDE will catch the error and give you chance to handle it before sending the code to PHP for parsing.

If you press OK, the dialog will close and the problem line will be highlighted and marked as the next line to process. Fix the problem, save your changes and select Debug -> Restart (Ctrl+Shift+F5) from the menu to restart your debugging session.
Exception Settings
You can set which exceptions the debugger will stop, or not stop on by selecting Debug -> Windows -> Exception Settings form the menu.

You will see this expandable list which you can use to turn on or off the radio buttons to change the debuggers behavior.
Working with breakpoints
Breakpoints allow you to pause the execution of the script on a particular line to investigate the state of your script at that point. This gives you the ability to watch changes as you step through your scripts execution from one breakpoint to the next.
There are several ways you can set a breakpoint on a line of code. If you click on the far left margin a breakpoint will be added to that line. Clicking on any breakpoint displayed in the margin will remove from that line.
You can also select Debug -> Toggle breakpoint (F9) from the menu to add or remove a breakpoint to the line you are currently working on.
If you do not want to remove a breakpoint, you can also temporarily disable it by moving your mouse over the breakpoint in the margin and selecting the option to disable from the options that pop up. You follow the same exact process to enable a breakpoint that is currently disabled.
You can also set conditions that must be met for the break to trigger or special actions to take by moving your mouse over a breakpoint and selecting the settings option from the pop up.

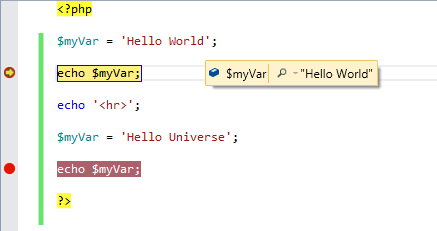
While the execution of the script is paused, you can easily inspect the value of a variable by hovering over it. These are called DataTips.

It is important to remember that we are viewing the current state of any variable at that specific point in the scripts execution. Looking at the example above, all instances of $myVar will contain the value Hello World when you hover over it since we have not executed the line that changes it to Hello Universe yet.
When you select Continue from the debugger line of the IDE, it will pause at the next breakpoint and $myVar will now contain the value Hello Universe.
Stepping through your code
While the execution of your script is paused, you can also step through the code between breakpoints. These are Step Into, Step Over and Step Out.
To execute the next line of code and pause you would use Step Into by selecting Debug -> Step Into (F11) from the menu. If the next line is the start of a function, you would pause at the first statement within that function.
If your next line of code is a function block, you can run the entire block and pause at the next statement after it by using the Debug -> Step Over (F10) option.
If you are currently stepping inside a function block and do not need to stop at any more lines within the function, you can skip them and pause at the next statement outside the function by using the Debug -> Step Out (Ctrl+F11) option.
Modifying Values
You can change the value of any defined variable using the Locals window. If it is not currently displayed you can find bring it up by selecting Debug -> Windows -> Locals (Ctrl+Alt+V L) from the menu.

Simply double click on the value you want to change and you will be able to edit it. Any changes you make will be the current state of that variable as you step through your code until code is executed within your script that changes it.
Conclusion
As this series concludes, my hope is that you have more information on using IDE's in general and specifically using PHP Tools for Microsoft Visual Studio, so that you can make an informed decision on what is right for you and your projects.
I have touched on the features that I see as important, however there are many more features available than space available to discuss them. I suggest you get the freely available version of Visual Studio and make use of the free trial period for PHP Tools provided by Devsense to explore the IDE in detail.
If you liked this article, please share it with your PHP developer friends. If you have a question about debugging support in PHP Tools, post a comment here.
You need to be a registered user or login to post a comment
Login Immediately with your account on:
Comments:
No comments were submitted yet.


